Lecture 20 Memory Management
Android is designed to run on resource constrained devices, and one of the most constrained resources is the device’s memory. Because of this, a large part of the Android framework and how we interact with application components deals with how the system manages memory, making sure sufficient memory is available for whatever the user wants to do.
In this short tutorial, you will explore how the Android operating system handles memory, and learn how to use the Android Monitor’s Memory Monitor to view your application’s memory usage and identify potential memory leaks.
The code for this tutorial can be found at https://github.com/info448/lab-memory. Note that you will not be required to write much code for this lab; it is more about using the tools and inspecting the logged output to get a sense for how memory is handled in Android. You should be able to complete this tutorial on either the emulator or a physical device.
This tutorial is based on Android Studio version 2.3.3. Android Studio 3.0 introduces a different set of profiling tools, though they should work in a similar way.
20.1 Memory Allocation
First, a short introduction to how memory is handled by a computer (including mobile computers):
The basic idea is that your computer has some amount of storage space (in RAM) dedicating to remembering all of the variables and objects that you create in your program. If you declare a new variable
int number = 448;that value (448) is “written down” in memory so it can be used later. For example, this int takes up 32 bits, or 4 bytes, of memory. Every single variable you create takes up some amount of memory (see e.g., here).
This data is stored in a section of memory called the “heap”, which is the part of memory dedicated to dynamic memory (e.g., values that may only need to be remembered for a short time). You can think of the heap as a something like a giant array or list of bytes, a certain number of which are allocated (given) to each new value that needs to be stored. Thus if spots 0 through 100 in the heap are allocated, declaring a new variable may be allocated (placed) at spot 101.
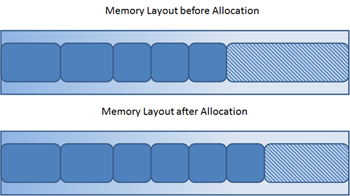
Example of memory allocation, from dynatrace.com.
Memory management thus involves answering two questions:
- Where do we put new values that we need to allocate memory for?
- What do we do with variables that we no longer need to remember?
Java (and by extension, Android) answers the second question in part by using what is called the garbage collector. This is a system process that periodically “sweeps” (searches) for any values that are no longer being used—that is, the variables are out of scope or otherwise cannot be referenced. These values are then “garbage collected”: the space is deallocated so that future values can be placed there instead.
Garbage collection is a bit like going through an apartment and marking rooms as “vacant” if no one lives there anymore.
Java’s garbage collection means we don’t need to handle deallocating memory ourselves—unlike in languages such as C where you need to manually manage your own memory!
The Android framework is structured so that when memory gets low, the system will destroy any stopped Activities, thereby allowing them to be garbage collected (and freeing up the memory to be used by a different application). You’ll be able to see this process in action in the next section.
20.2 The Memory Monitor
Since we’re interested in the memory used by the application, you should enable and view the Memory Monitor provided by Android Studio. If you look at the bottom panel (the Android Monitor panel) where you normally see the Logcat results, you should see a tab called Monitors. Click on this to view the memory usage over time (you can ignore the other monitors for now).
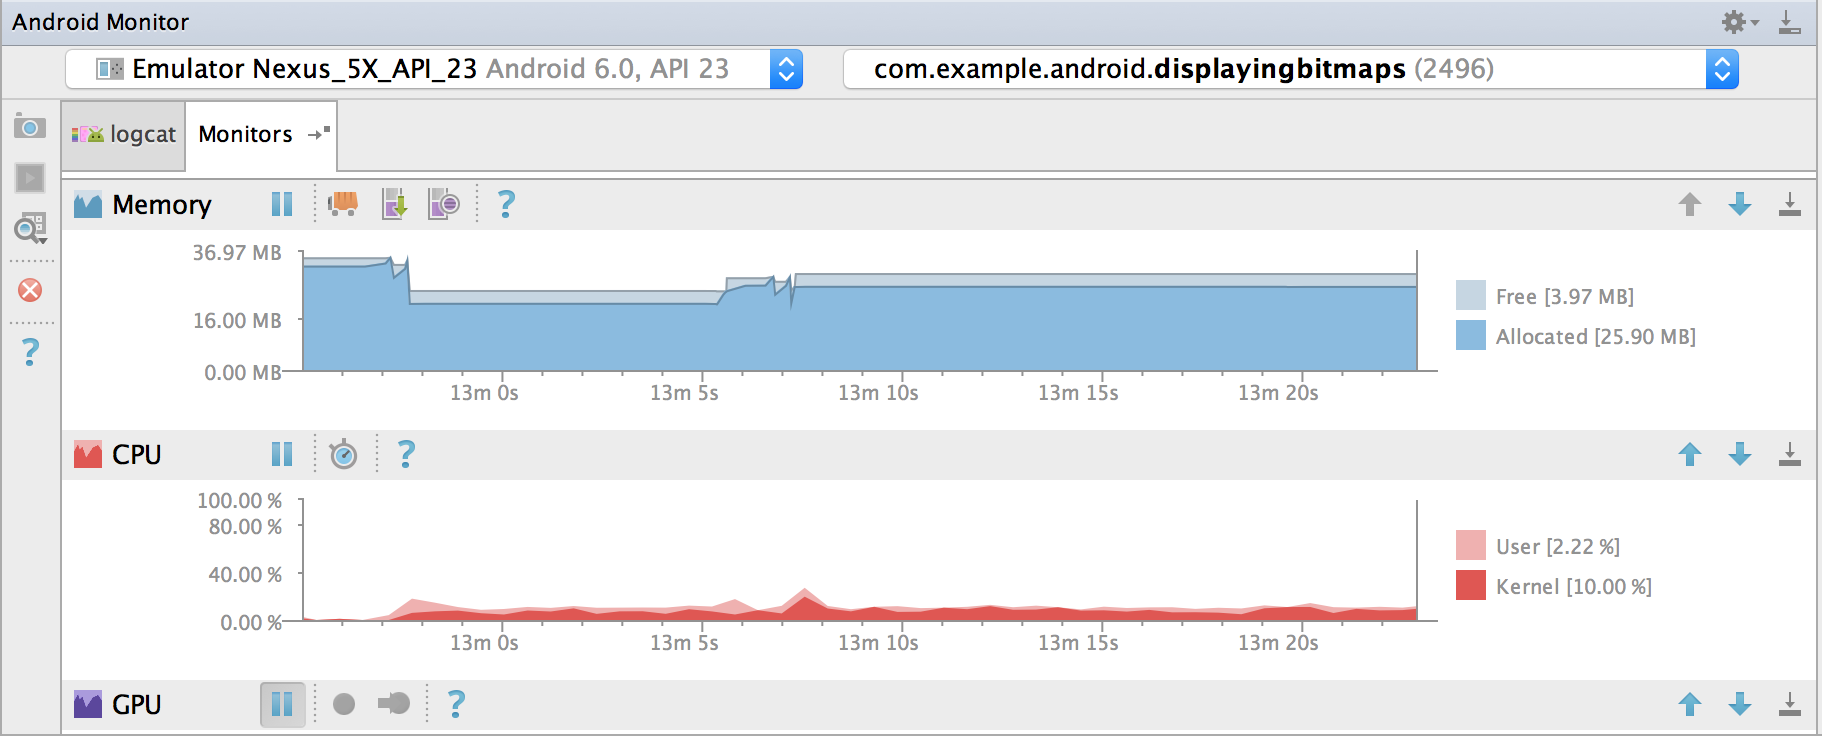
Android Memory Monitor (Google)
The dark-blue section represents allocated memory (i.e., the amount of memory being used to store variables), while the light-blue section represents free memory (in this case, the amount of memory that the application is budgeted by the operating system). Each section also has a size in megabytes listed on the right. We’re primarily interested in the dark-blue allocated memory, but check in with the instructor if you have questions about the free memory.
When you first start up the app, you should see that some memory has been allocated, but it shouldn’t be changing at all (since the MainActivity doesn’t create any new variables after it is created). But let’s change that!
While watching the monitor, click on the “BLANK ACTIVITY” button to be taken to a new (blank) Activity. Did you see the bar go up?! This is because opening a new Activity required allocating additional memory for that Activity (particularly its Views, since it doesn’t do much else).
- Of course, the bar didn’t go up by much; that’s because this simple Activity doesn’t require a lot of memory. In practice, even a lot of
ButtonsandTextViewsdon’t require large amounts of memory.
Navigate back to the MainActivity. You might see the memory allocation increase a little more, as restarting the Activity can cause the Views to need to be recreated.
Garbage Collection
Let’s see how the Java (technically, Dalvik) virtual machine handles memory. From the MainActivity, click on the button to go to the ProgressActivity. This Activity will show the progress towards completing a number of undefined tasks (it’s just showing a bunch of ProgressBar Views, which use a bit more memory than standard buttons).
- When you visited this
Activity, you should have seen the memory allocation jump up!
Now try navigating back and forth between the MainActivity and the ProgressActivity. You should see the allocated memory continue to increase (since we need to keep recreating those spinners), getting closer and closer to the amount of “free” memory. Eventually, Android will decide that it’s out of memory, and will initiate garbage collection, deallocating the memory that has previously been used to create the old spinners which are no longer needed (because that instance of the Activity is gone).
Android will sometimes increase the amount of free memory available as the app asks for more. This is normal.
When the garbage collection occurs, you should see the amount of allocated memory suddenly drop. Those “cliffs” are the garbage collector running.
There are actually different forms of garbage collection (which make different decisions about which values are “old enough” to be deallocated), and the one that you just triggered may not have collected everything. You can also use the memory monitor to manually initiate garbage collection—this is useful for checking if memory is actually being used, or just hasn’t been cleaned up yet.
Manually initiate the garbage collection by clicking the “Initiate GC” button (
 ) at the top of the memory monitor panel. What happens? Were there other values that could be cleaned up?
Note that in practice, you should not try to perform garbage collection on your own—let the system do its own work (it is optimized to make sure that the computer doesn’t slow down too much when trying to do cleanup, which requires additional processing). This button is purely for testing and inspection.
20.3 Memory Leaks
Android’s garbage collection does a fine job of cleaning up memory… assuming that it can correctly identify the values that aren’t being used. This can sometimes be tricky: Java decides that a value is eligible for garbage collection whenever there are no longer any references to that value (e.g., no variables are in scope). However, if you’re not careful it’s often easy to leave an extra reference floating around that you didn’t intend, thereby keeping the memory from being deallocated. This is referred to as a memory leak (because the amount of available space is “leaking” away).
For example, consider the BirdActivity class, that you can view by clicking on the “BIRD ACTIVITY” button. This activity shows a relatively high-resolution image of a bird—when you open the Activity, you should see the amount of allocated memory jump up dramatically since we need to load that Drawable into memory.
If you click on the BirdActivity’s button, you’ll be taken to (another) blank Activity. Since the bird image is no longer being shown, it should no longer be used and thus should be eligible for garbage collection. Hit the “Initiate GC” button again to request that Android sweep up and reclaim that memory. What happens?
You’ll notice that the large amount of memory allocated to the image doesn’t go away… it looks like the bird isn’t being garbage collected!
Why not? Recall that when we start new Activities, old Activities are put on a back stack, allowing us to be able to hit the “back” button and return to the previous Activity. This means that each Activity in the stack contains a reference to the previous ones… including the resources that they have loaded into memory! So there is in fact a reference to that image—it’s in the object that is stored on the backstack!
This can be a problem. It means that because we have that history, the amount of memory available to our application is smaller even though we’re not actually looking at the pretty bird right now.
We can fix this by utilizing the Activity lifecycle callbacks. Specifically, you can remove the reference to the image when the the Activity stops, and then reload the image when the Activity starts again.
For practice, in the
BirdActivity, override theonStop()method. Inside this method, set theImageView’s drawable to benull.Similarly, override the the
onStart()method so it loads and displays the image when theActivityis (re)started. You can just move the relevant code fromonCreate().
Once you’ve done this, try navigating to the BirdActivity and clicking the button to go to the BlankBirdActivity. Use the “Initiate GC” button to force a garbage collection sweep—does the image’s memory get cleaned up now?
- While this does mean that we’re not using as much memory when the
Activityisn’t shown, it does mean that returning to theActivityis slightly slower (since we need to reload the image). This is the fundamental trade-off in all of programming optimization: use of space vs. use of time.
Now you should have a sense for how values in Android can influence memory usage. The main take-away is that you want to be careful to de-reference any object that take significant memory (like images or other media; this is why we released the MediaPlayer when discussing Services).
- Additionally: note that
staticvariables are never de-referenced and so are never garbage-collected. Thus you want to avoidstaticvariables for anything more complex than aStringto avoid more memory leaks!
Finally, if you use the memory monitor and see memory usage stacking up, that is not necessarily a memory leak or other problem: it could just be that the system hasn’t run garbage collection yet! A memory leak is when resources that should be able to be reclaimed cannot be—but as long as you keep variables local and de-reference large objects, you’ll be fine!
Android Studio includes numerous other monitors for profiling the performance of your application. See Android Monitor and Performance and Power for more details. Additionally, Android Studio 3 contains a new set of profiling tools (but the basic concepts work the same way).
Avoid pre-mature optimization! Make sure that you can get your app working first, and then utilize these tools to solve specific problems, such as slow performance.